Reading the city,
to back a store-siting decision.
Deciding where to open a shop on gut feeling or social-media buzz alone is unsettling. Placebook is a map service: it colors the city on a hexagon map, and lets you check whether a specific property can actually work. It's free to use, with no registration, on both smartphone and desktop. It's in beta at the same time across five cities: Fukuoka, Kitakyushu, Kumamoto, Kamo, and Kishiwada.
The map and the city-stage view work the same way across all five cities. Restaurant data, foot-traffic cameras, and rent benchmarks are being rolled out city by city, starting with Fukuoka City, where the underlying data is most developed.
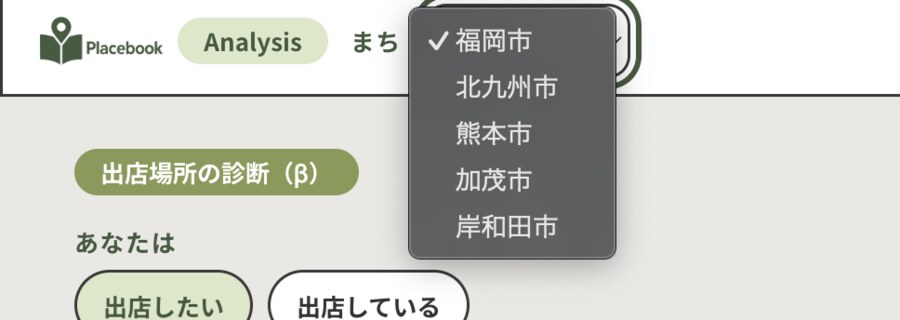
The city dropdown switches between all five cities (actual screen, Japanese interface)
Coloring the city, five ways.
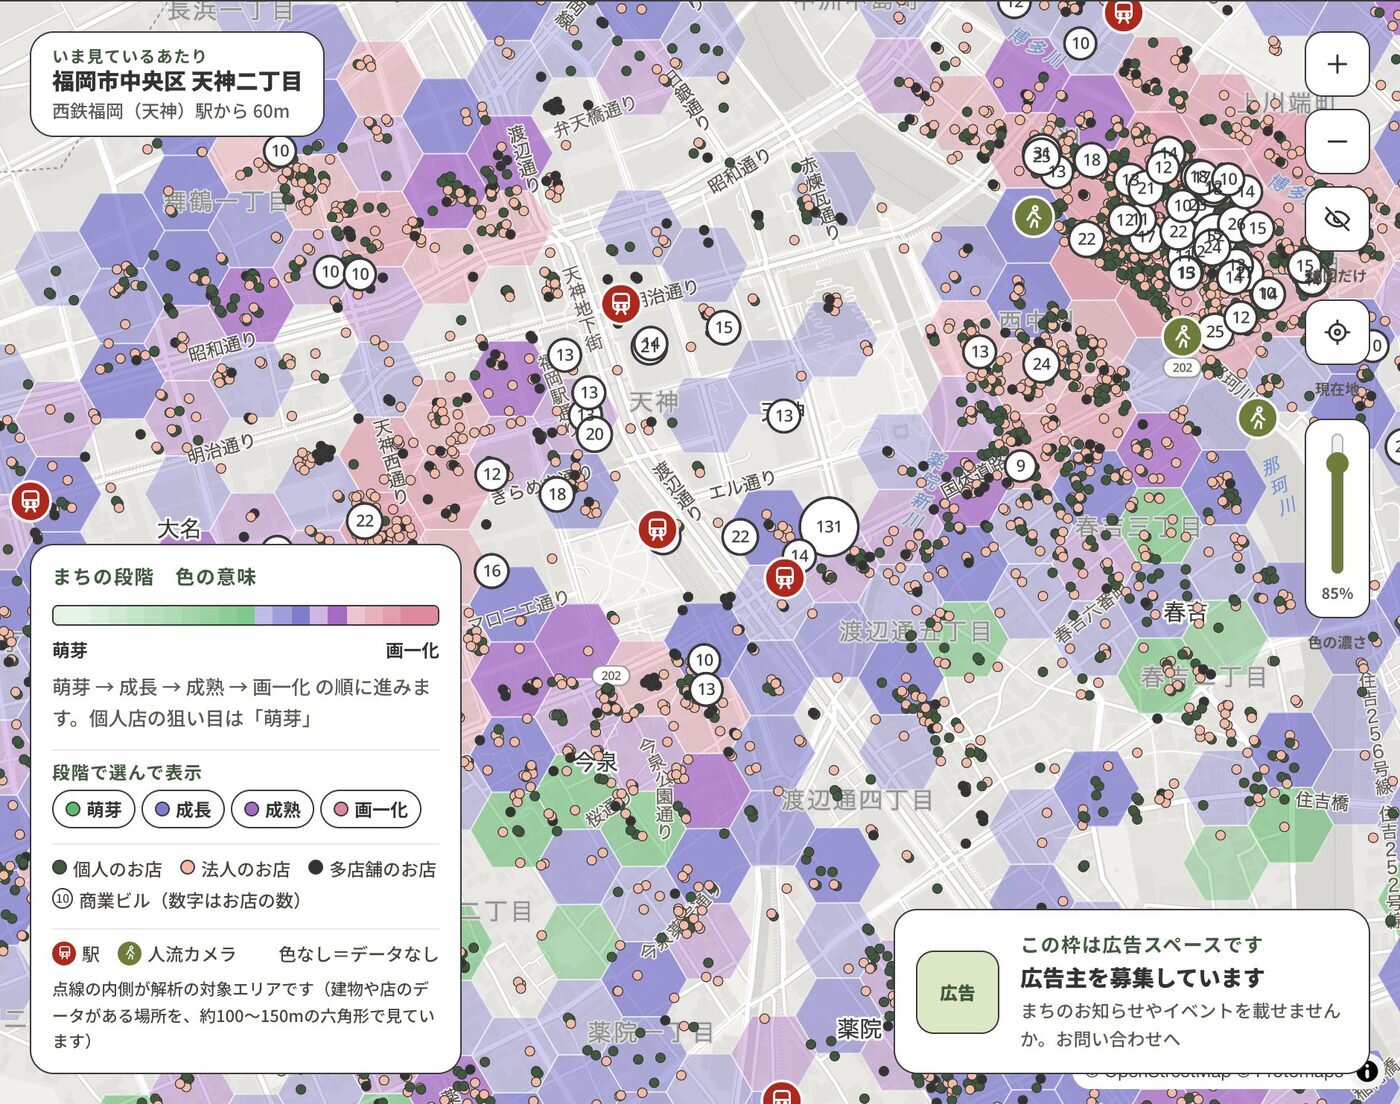
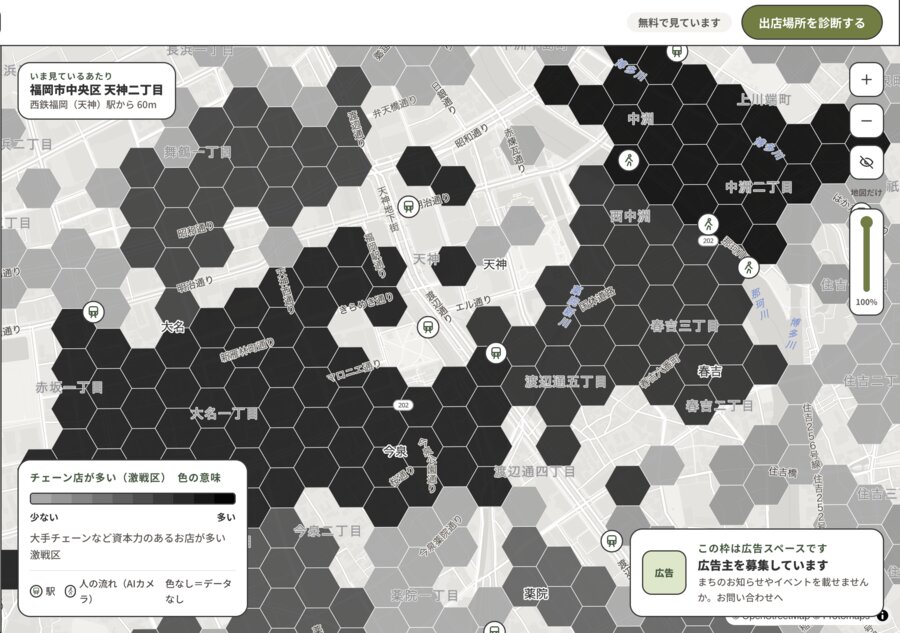
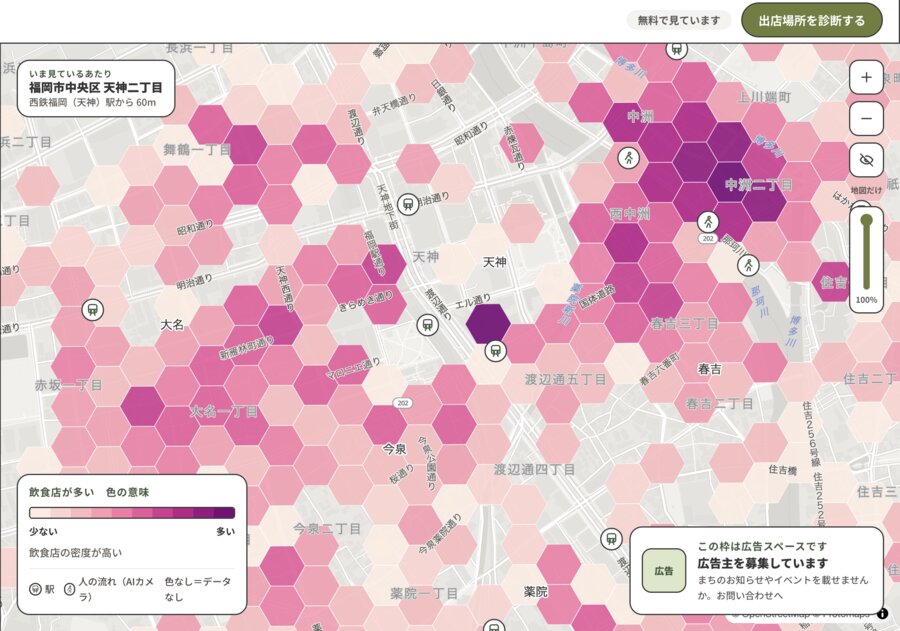
Part of our area analysis is available right on the Placebook map. Each hexagon is 100–150m across; the deeper the color, the stronger that trait is in the area. Starting from the city's stage of development, you can compare how residential, commercial, chain-store, and restaurant density overlap — and choose where to set up shop by reading the map, not by guessing.
- City stageReads the pattern of where shops have clustered and shows which of four stages an area is in right now — sprouting, growing, mature, or uniform — in four colors. It draws on the thinking behind Creative Index, the area-evaluation metric URBANIX is developing, and applies research from Kyushu University Graduate School to read where a city is heading next. Sprouting areas are residential-led spots about to take off — prime targets for independent shops; uniform areas are commercial-heavy spots where chains have moved in. Look at sprouting areas to plant a seed while rent and competition are still quiet, and at mature or uniform areas when you want a proven track record of footfall.
- Residential-heavy areasThe share of buildings that are residential. The darker the color, the more people are around on weekday afternoons and evenings. Morning markets, bakeries, prepared foods, and kids' events draw more people when placed near heavily residential areas.
- Commercial-heavy areasThe share of buildings that are commercial facilities. The darker the color, the more shops are clustered there — places people stop by while out shopping. Higher-priced goods, or drop-in items like sundries and light snacks, do well where this color is darker.
- Chain-heavy areas (high-competition zones)These are places major chains and multi-location businesses have judged worth opening in. Foot traffic here has already been proven by other companies' investment, so if you're unsure where to hold your very first day, choosing from here is the safest bet.
- Restaurant-heavy areasThe color deepens with the number of restaurants and bars — darker areas are where dining spots cluster into a single dense pocket. Food-walking and food-truck concepts can add to the density in a dark area, or have a light area all to themselves.
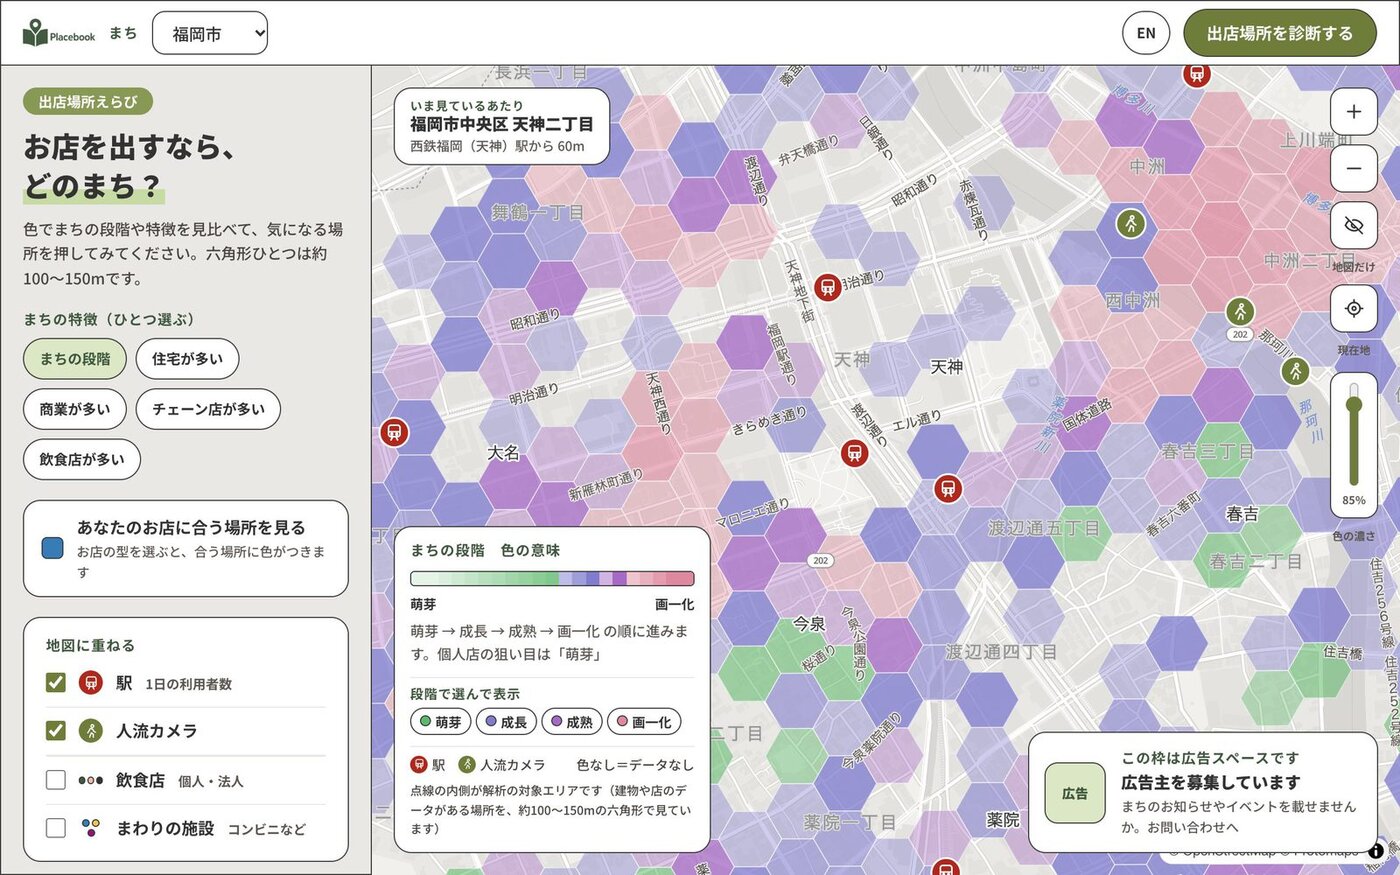
The city-stage screen in four colors (actual screen, Japanese interface). Example: around Tenjin, Fukuoka City.
Tap a hexagon, and the key facts come up.
Tap a hexagon and a single card shows the city stage, whether it fits your type of shop, how much residential and chain-store presence there is, the number of restaurants within a 5-minute walk (with a breakdown of independents), the nearest station, and a rent benchmark. From there you can go straight into checking a property.
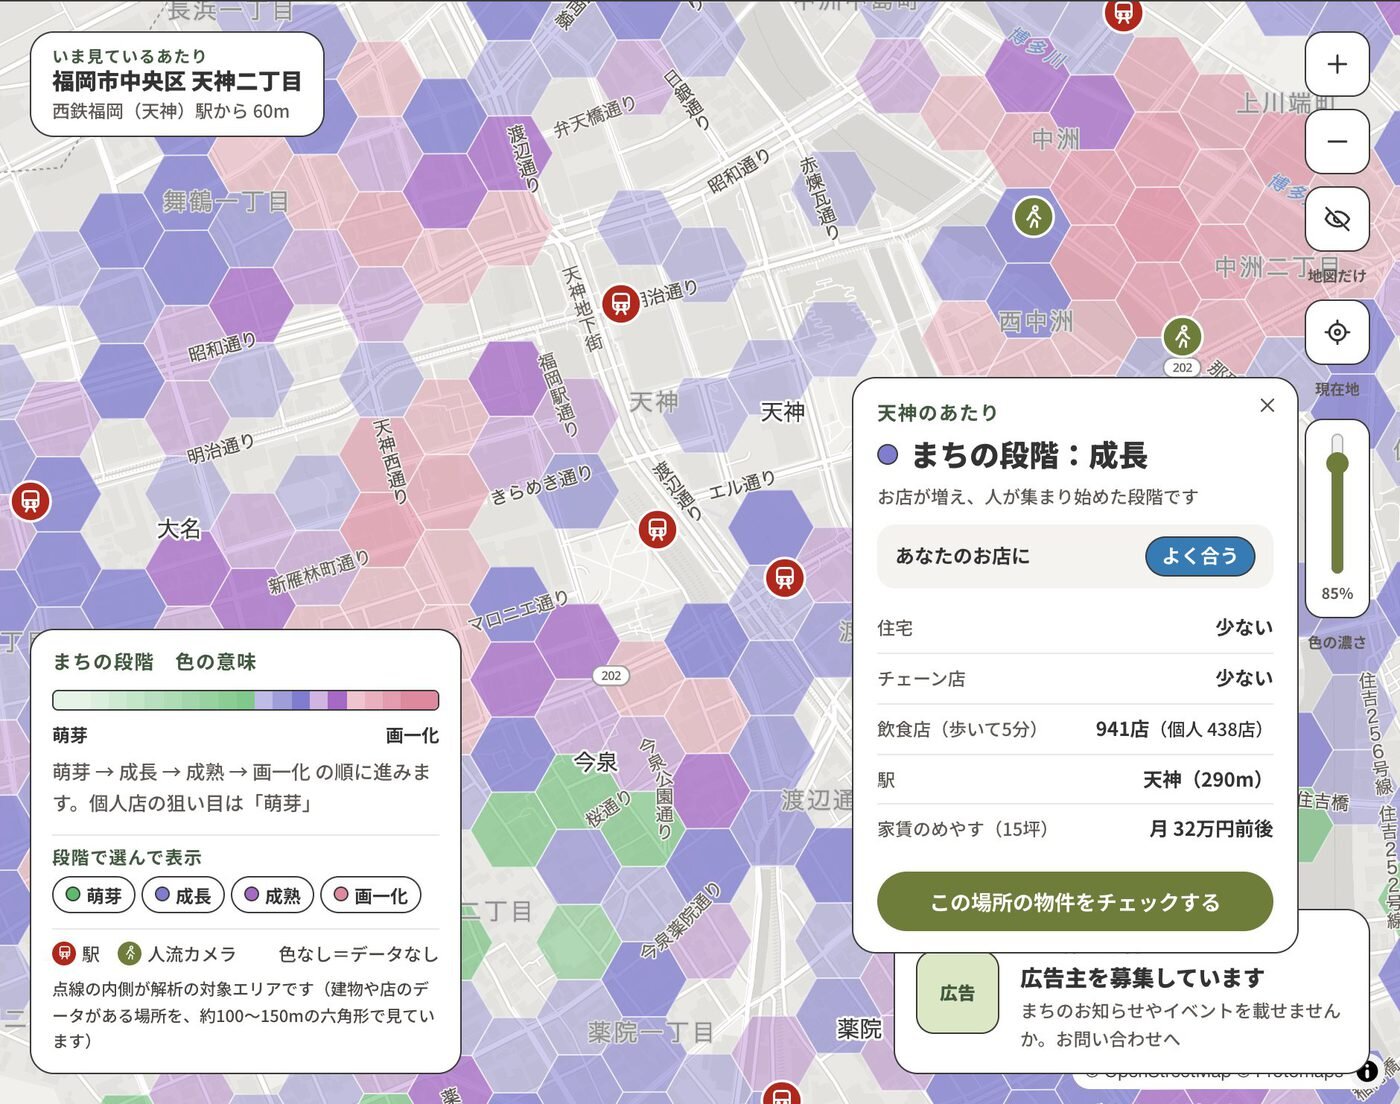
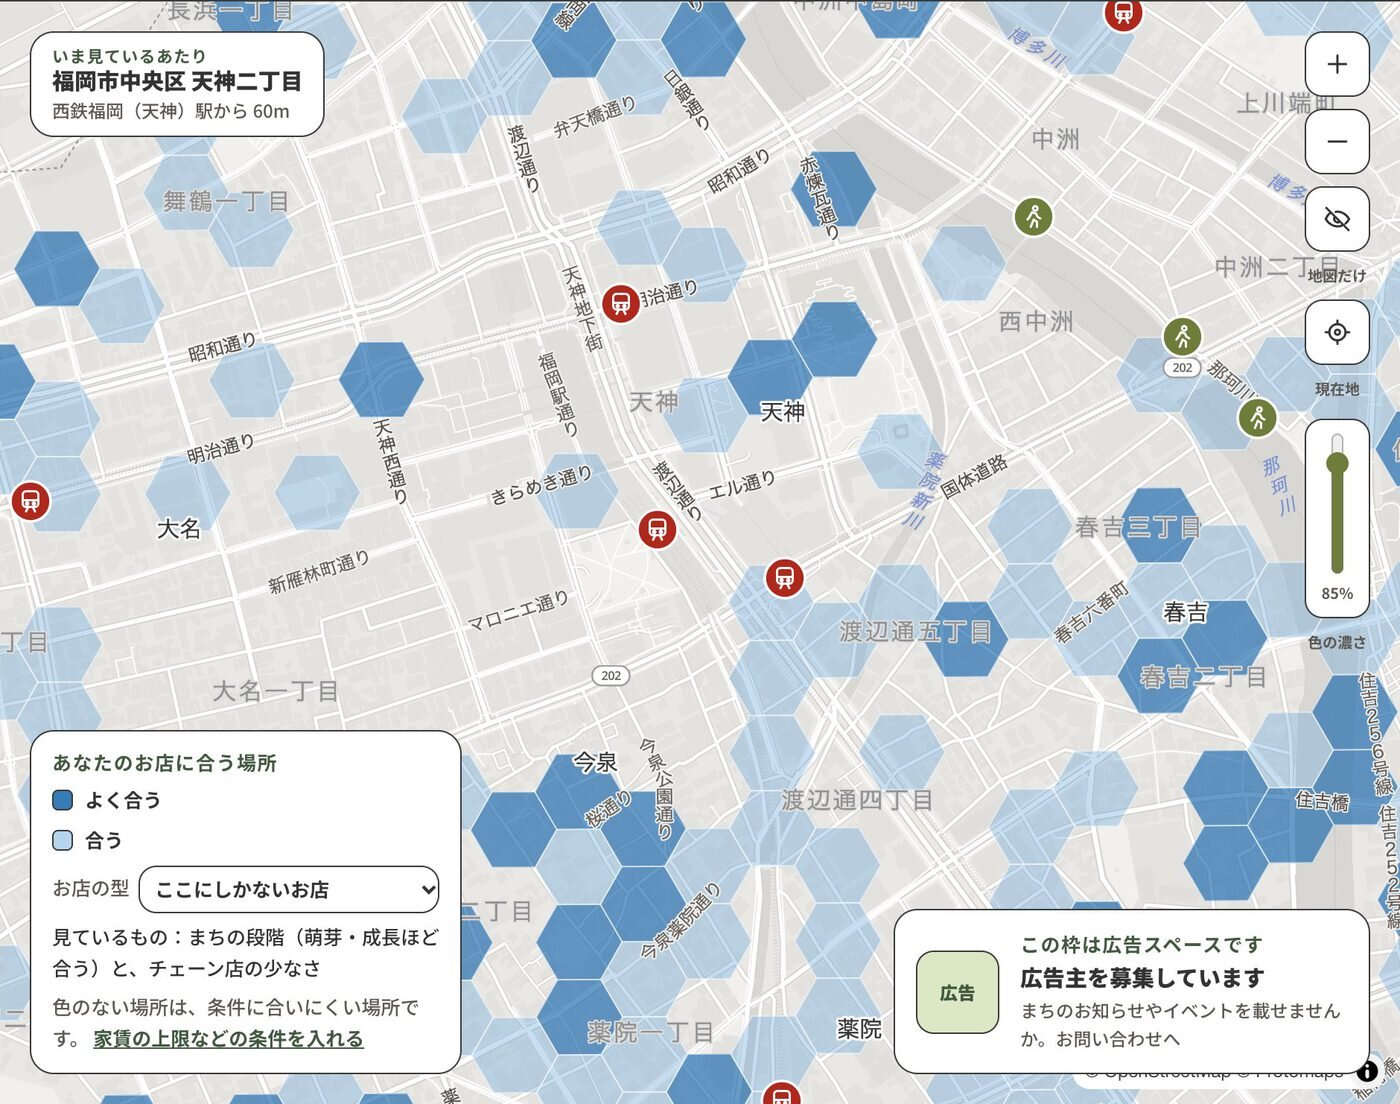
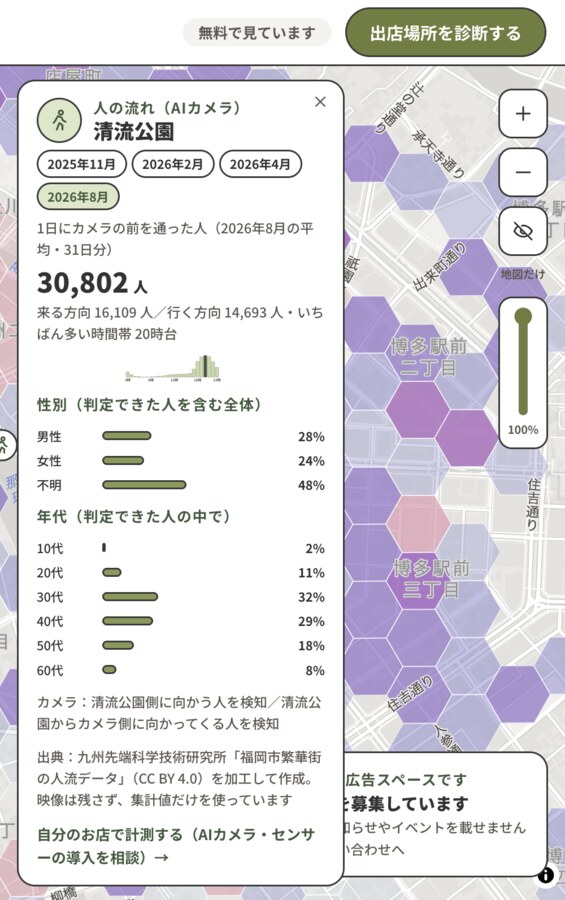
You can also overlay station ridership trends, AI-camera foot-traffic data, and nearby facilities such as convenience stores, supermarkets, and hotels. Foot-traffic data (free) from cameras installed in shopping districts and public open spaces can be clicked for details: daily passersby, the trend by time of day, and — where it can be determined — a breakdown by gender and age (Fukuoka City).
Confirm a property
actually works, before you sign.
Once the map or the area diagnosis has turned up a candidate, the next step is confirming whether it works at that rent before you sign. Just photograph the listing and Placebook reads off the rent, management fee, deposit, key money, floor area, and address — try as many properties as you like, for free, with no registration.
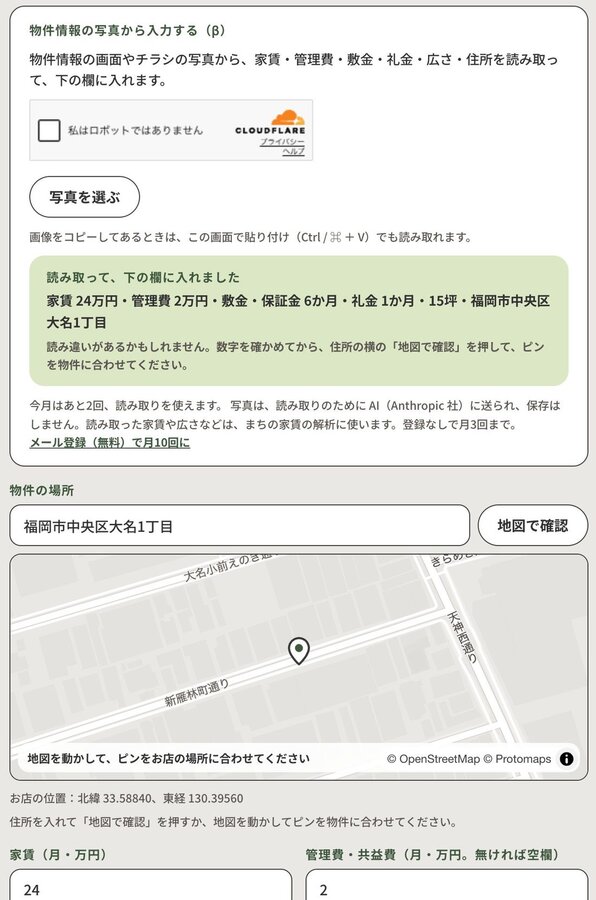
Entering details from a photo of a property listing (actual screen, Japanese interface, sample input)
The verdict comes from three angles — profitability, rent, and city stage — as "worth pursuing," "reconsider the terms," or "pass." When the numbers are tight, Placebook works backward to show what rent, average spend per customer, or seat count would make it work.
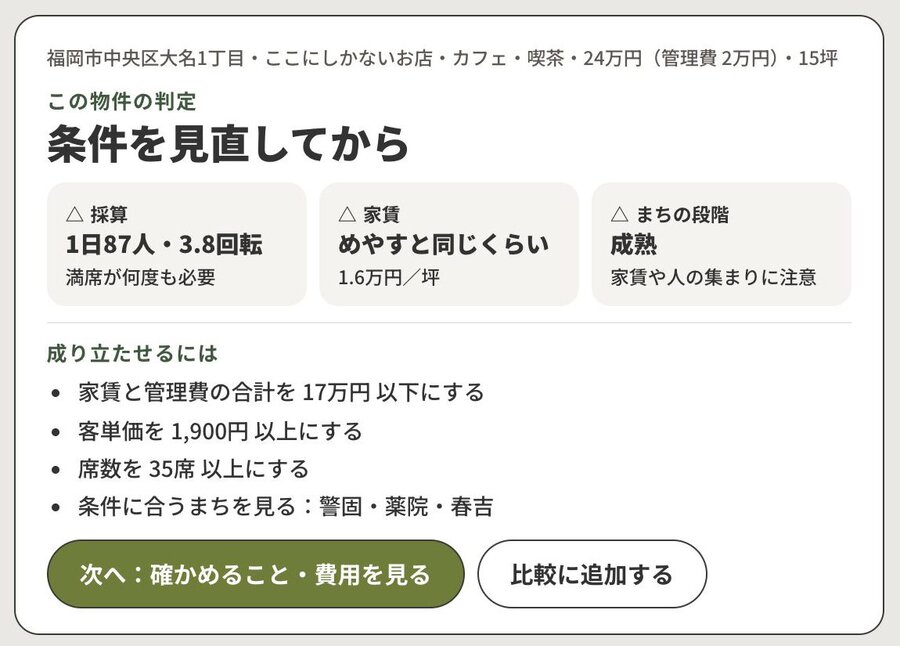
The verdict screen (actual screen, Japanese interface, sample input)
Ask the AI for advice
Write up your shop's concept, and the AI gives advice alongside the verdict. The numbers and the verdict itself always come from a fixed formula; the AI's job is to put that result into words tailored to your shop (beta).
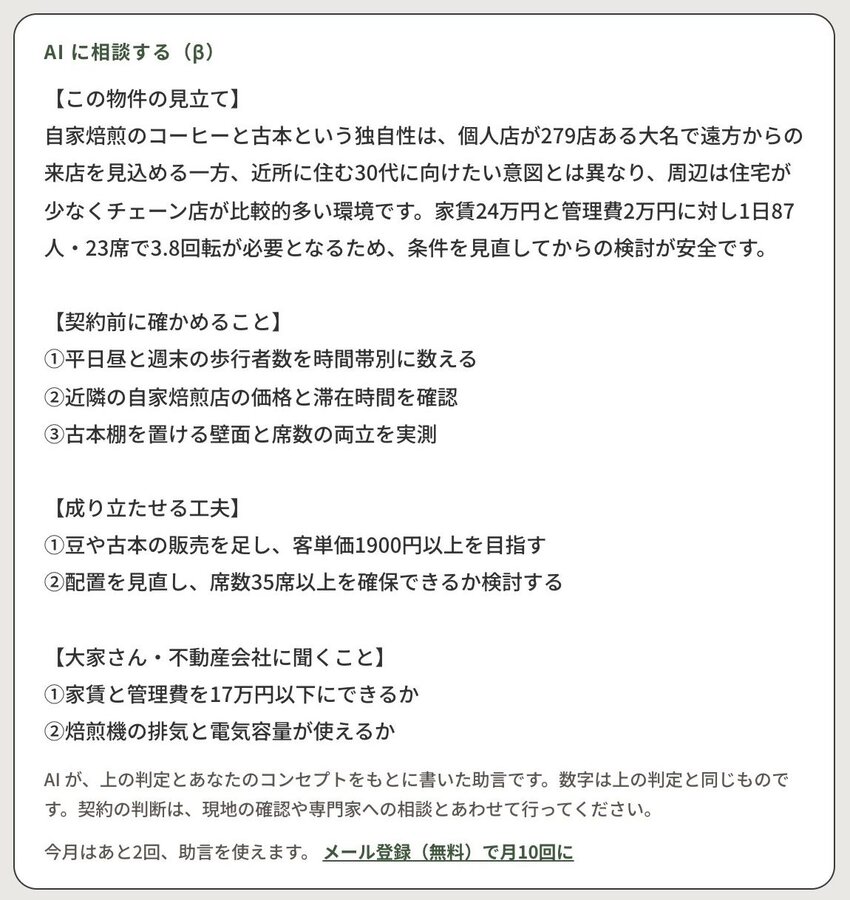
Get ready before you decide
A checklist of what to confirm on site, a benchmark for upfront costs, side-by-side comparison of up to three properties, and link-based sharing — plus a direct line to consult URBANIX on the design of the store space itself (first 30 minutes free).
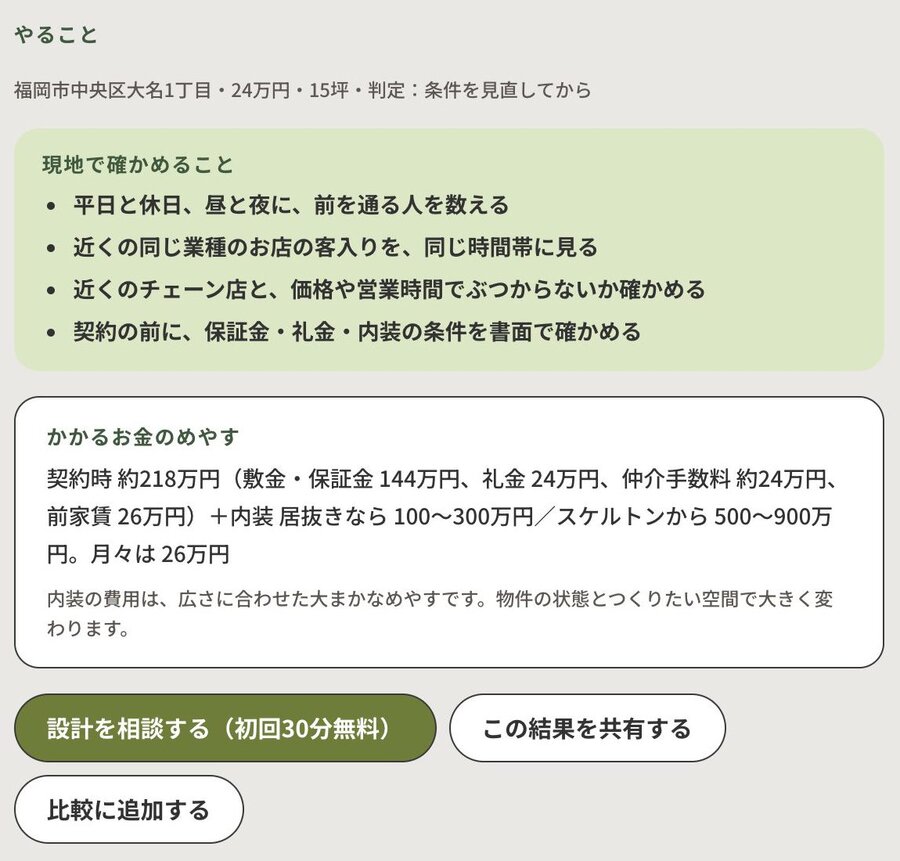
Checking a property is unlimited even without registration. AI advice and reading from a photo are capped at 3 times a month without registration, or 10 times a month with free email registration (no password required).
For those responsible for moving an entire area.
This layers area-management analysis onto the same map. We measure foot traffic, analyze the structure of the area, and record the results in numbers — all in one package. What we deliver is the area analysis; the AI camera is just one way of gathering the data for it.
The data we measure is recorded and accumulated, so you can compare it over time as a basis for ongoing area-management decisions. When the standard three steps aren't enough, URBANIX can also support more advanced analysis directly.
Pricing works differently depending on whether we're borrowing footage from cameras already in place, or installing new cameras and sensors. Get in touch first — we'll walk you through the options once we understand your area.