We take on the whole sequence: measuring foot traffic in an area, analyzing the district, and turning the results into hard numbers. What we deliver is analysis of the area — the AI camera is just one way of gathering the data behind it.
Area management organizationsShopping street associationsTourism associationsCommercial facility operators & landownersOwners of public open space & vacant units
Placebook itself (Analysis Mode and the property check) is a free map and property-check tool for anyone considering where to open a shop. Placebook Pro adds a layer of foot-traffic measurement and analysis on that same map, for the people who manage the area as a whole.
01ISSUE
Is that empty space just sitting there?
No clue how to activate it
No idea where, when, or what would draw people in
Foot traffic through public open space or a vacant unit is only ever a guess.
It doesn't reach the people who want it
Would-be vendors exist, but they never hear about the space
Every call for vendors means reaching out all over again — a real operational burden.
No way to show the results
Can't put a number on the effect it's having
Hard to show tenants or local government the outcome, or the case for further investment.
What Placebook solves: we make foot traffic visible, connect the space to people who want to open there, and show the results in numbers — growing it, within the bounds of what a public open space allows, into a place that keeps getting used.
02FLOW
Four steps, one continuous flow
See, measure, connect, show. Any one alone doesn't lead anywhere
01 SEE
See the city's character on a map
The analysis map puts the city's character on a map, giving you a starting point for how to use the space.
02 MEASURE
Put foot traffic on the map
Foot traffic measured by AI cameras in front of the space is visualized directly on Placebook's map.
03 CONNECT
Connect the space to vendors
We list the vacant space and the call for vendors on Placebook's map, so it reaches the people who want it.
04 REPORT
Verify results and write the report
We verify the effect of each initiative based on changes in foot traffic and other before-and-after measures, and compile it into a report.
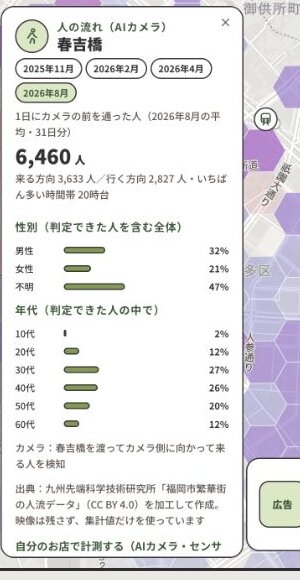
Sample foot-traffic display | Harayoshibashi, Fukuoka City (August 2026). Shows daily passersby and direction, peak hours, the gender and age breakdown, and month-over-month comparison. No footage is kept — only the aggregated counts.
Mockup | Foot-traffic measurements overlaid on the city analysis. Each dot marks a measurement point — click one to see its foot-traffic data. Figures shown are samples.
03ANALYSIS
Reading foot-traffic numbers against the structure of the city
POPULATION
Population density and movement patterns
We look at households within walking distance, station ridership, and routes from residential areas to see where people move day to day.
MESH
Catchment mesh analysis
In 100m-diameter cells, you can see how housing, commerce, and dining cluster, and how much vendor demand each area draws — all overlaid on the city.
VISIBILITY
Visibility & sightline analysis
We identify spots that catch passersby's eyes — evidence for choosing where to make an activity visible.
WALKABILITY
Walkability & walking-distance analysis
Using the real walking-distance area from stations and parking lots, together with the state of sidewalk infrastructure, we find where pedestrian flow breaks down.
STOCK
Vacant homes & storefronts analysis
We overlay the distribution of vacant storefronts with the share of elderly single-person households to forecast where vacancies are likely to appear next.
CONTENTS
Social media & time-of-day analysis
We find missed opportunities in the gap between where and when people post on social media and when businesses are actually open.
The above are examples of analysis available under the base package. We also offer custom analysis tailored to an area's specific challenges (quoted separately).
04DIFFERENCE
How this is different from other companies' AI cameras
Connected to the map
The foot traffic we measure flows straight into the area-analysis map. The data doesn't stop inside a report.
Reads the structure of the city
We overlay the catchment mesh, visibility, walkability, and vacant stock onto foot-traffic numbers to show why people are there in the first place.
Connected to the property check
Places where foot traffic is picking up also surface in the property check and AI advice used by people considering where to open a shop. Analysis turns into real interest.
No other AI camera service does all three. This isn't a tool for measuring foot traffic — it's a system for moving the city.
05PRIVACY
We don't identify individuals
About privacy
Camera footage is processed on the device itself, and people are automatically masked. What we hand over is only aggregated figures — foot traffic, dwell time, and the like.
No facial recognition, personal identification, or tracking of specific individuals
We don't use data that way, period
Raw footage itself is never stored or provided to anyone
We explain our operating practices in writing before you sign on
06PROGRESS
Measure first, grow it over a year
The goal isn't a single burst of activity — it's a place where users' trial and error keeps accumulating and the value keeps growing. You can move through this in stages: start with a short measurement to understand the space, then grow it, then expand it across the area.
STEP 1 Get to know the space
Foot-traffic survey & analysis
Install an AI camera and measure for two weeks to a month. We analyze the count and flow by day of week and time of day, and organize candidate uses. Deliverables: a foot-traffic analysis report and a set of use hypotheses
STEP 2 Grow it over a year
Vendor recruitment & operations support
We keep measuring with the AI camera while supporting vendor recruitment and coordination for a full year, including regular outreach and help with the public-open-space filing. Deliverables: ongoing foot-traffic data and a record of the vendors hosted
STEP 3 Expand across the area
Area / district rollout
We install AI cameras at multiple points to understand foot traffic and circulation across the whole area, and recruit and operate across several vacant spaces together. Deliverables: an area-wide foot-traffic report
We recommend starting with STEP 1 to get to know the space, then growing it over a year with STEP 2. If you want to expand to the surrounding area, consider STEP 3.
07PRICE
Pricing depends on how the data is gathered
Borrowing footage from cameras already in place, and installing new cameras or sensors, are structurally different costs. Because the right figure depends on your area's situation, we don't publish a price list — we walk you through it after you get in touch.
Before you reach out, have this ready
The area you'd like covered
Whether cameras or sensors are already in place
An estimate of how many new sites you'd need
When using cameras you already have, the camera manufacturer's terms of use may prevent us from extracting the data.
We're also happy to discuss deployments funded through national or local government subsidies and grants.
CONTACT
Tell us the area you have in mind, and whether you already have cameras in place.
We'll walk you through the actual screens, including an example built for your own city.